The Surfside Reporting Dashboard: Real-Time Measurement for Real-World Attribution
When you run an advertising campaign, there’s one simple question that’s more important than anything else: did it work?
Most marketers are familiar with the daily struggle to measure performance: to understand your web traffic, you need to look at your web analytics tool. To get a full view of your ecommerce activity, you have to look at the metrics from your ecommerce platform. Important purchase data goes through your point-of-sale system and might not match what you’re seeing from an advertising platform. Total campaign impact isn’t visible without aggregating all these different insights into one big spreadsheet, which makes it hard to visualize what’s really working.
Campaign measurement depends on how effectively you can collect, measure, and activate your data. If the results of your campaign are fragmented across different platforms and channels, it can take a lot of time and resources to get useful insights.
In one survey, about half of marketing teams cited manual data reporting (49%) and data fragmentation (45%) as major challenges in making measurement useful. They also reported spending anywhere from 9 to 24 hours a week just collecting and measuring insights!
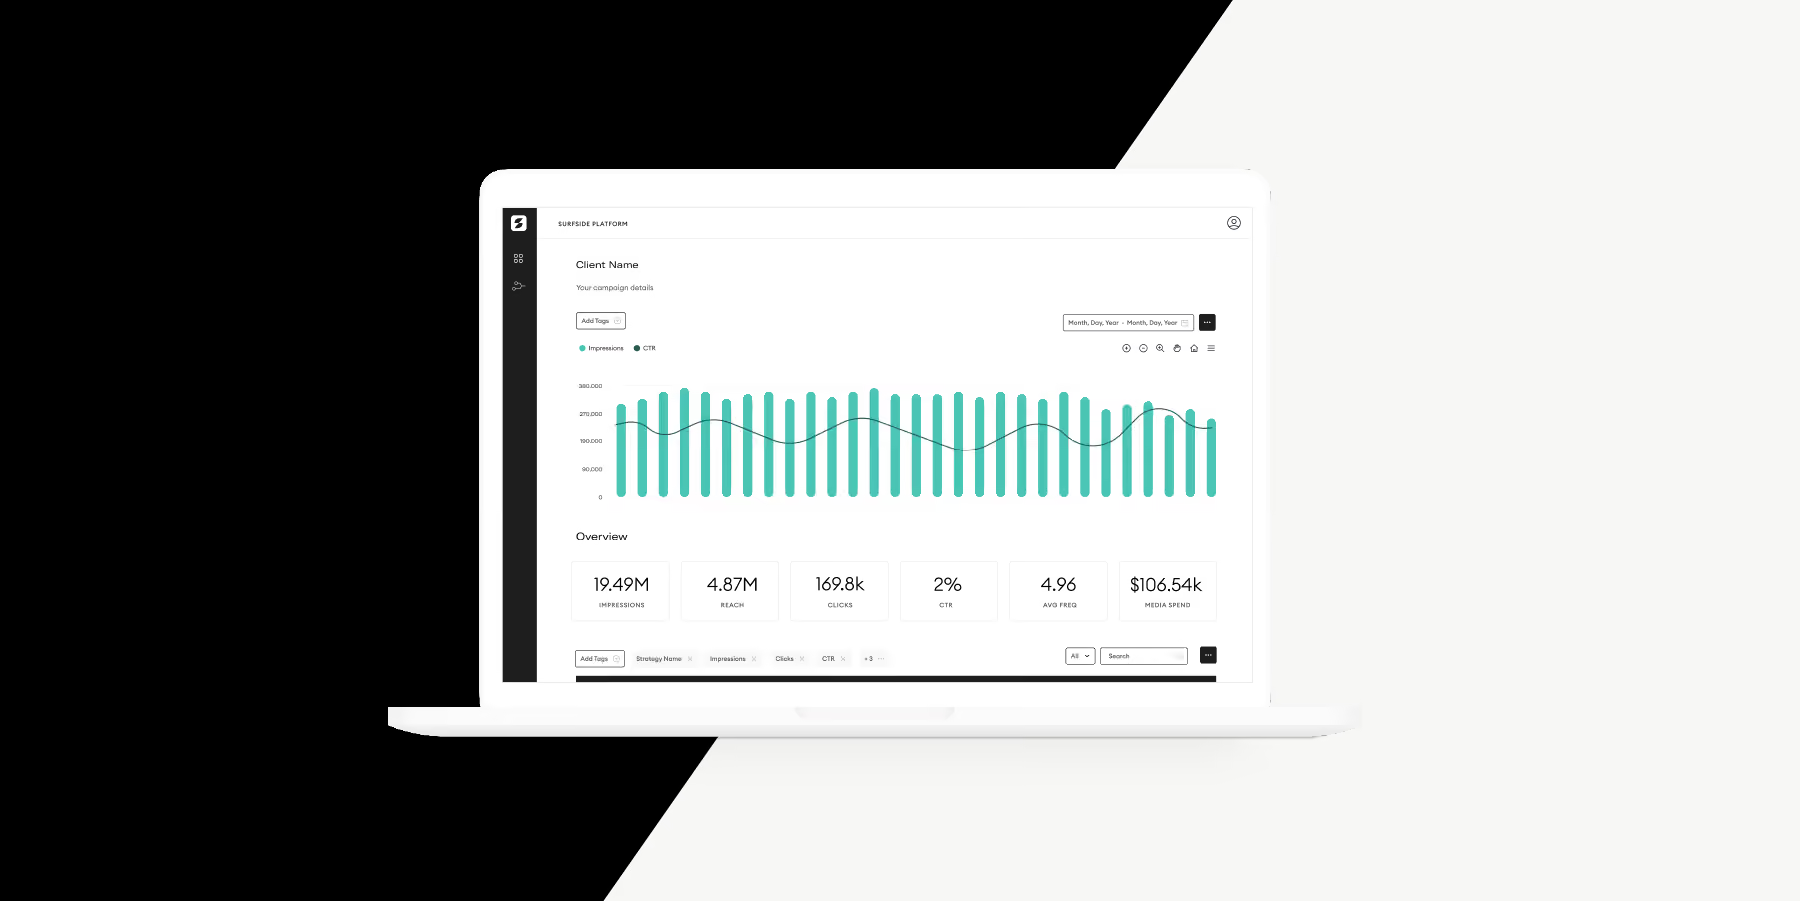
We built the Surfside Reporting Dashboard to simplify ad measurement by connecting the dots for marketing teams and making it easier to understand and optimize based on campaign performance - no spreadsheets required. The dashboard offers cannabis marketers a way to track and visualize the customer journey across digital ads, retail traffic, and ecommerce activity in real-time.
Since the dashboard is powered by direct integrations with websites, ecommerce platforms, location software development kits (SDKs), and point-of-sale systems, you can log in and immediately get the insights you want without logging into multiple platforms, switching browser tabs, or digging through Excel. Everything is in one place.
Every Surfside client gets access to the Surfside Reporting Dashboard from Day One. Most importantly, it’s all self-service. Clients can log into the platform at any point to measure, understand, and optimize based on those insights.
With the Surfside Reporting Dashboard, users can:
- Visualize real-time insights across ad engagement, ecommerce activity, and store visits all in one screen
- Add filters and tags to get a granular view of campaign details
- Create and export as many custom reports as you want, making it easy to share the results with the rest of the team
This release marks a major milestone in Surfside’s mission to simplify how companies connect with customers. As an all-in-one measurement solution, the Surfside Reporting Dashboard streamlines the way marketers collect and analyze campaign data, making it easier to see a full picture of campaign opportunities, successes, and goals across both online and offline activity.
Want to learn exactly what you can do with the Surfside Reporting Dashboard? Download the one-sheet for more details or get a demo!

Advertising and retail media in one place.
Spend smarter, and get more from your stores.